It was on a warm and breezy Friday afternoon that Luca, having indulged in a heavy lunch, found himself gazing at a determined squirrel that was perched on his window sill. The squirrel, clutching a stubborn nutshell with her tiny paws, executed an array of maneuvers with intense focus. She began by turning the nut around, testing its angles and seams, while steadily biting and gnawing with determination. Luca couldn't help draw a parallel to the time he had spent poring over lines of code, navigating the maze of his dataset with little success. Memories came rushing of the hours spent babysitting his model, in pursuit of a reasonable loss curve. Despite his best efforts, the model that had performed so well on the reported data inexplicably and repeatedly failed on his dataset. The model doesn't generalize, it just doesn't generalize . At that very moment, a gentle breeze swept in and comforted him. Gradually, he sensed his thoughts slowing down, his focus dwindling and his eyelids growing heavier...when an unexpected touch on his shoulder jolted him.
Come with me. Now. There's no time to explain
Wh..What?
Chapter 1: Explorers
TopAnd so it was, that Luca now found himself in a strange and peculiar land. What he saw seemed both familiar and foreign to him, as he stared in disbelief at the boundless expanse that lay before him. Suddenly, Luca's thoughts turned to the unfinished work, his model that was probably training, the cluttered desk and the creaky chair that he left behind, all of which seemed like a world far far away from the one he was now standing in. He was overcome with confusion regarding the nature of his journey and the identity of the woman who had led him here. As if sensing his doubt, she proceeded to announce, "Greetings to the land of DataRealm, where all data lives. Here, information flows like rivers and mountains of code rise into the sky. This is a realm of creation and discovery, where the human spirit and the digital domain converge to form a connected whole."

As his eyes swept across the landscape, it slowly dawned upon him, as he faintly noticed gigantic crystalline structures in a distance that stood tall, intricate with complex algorithms and databases. Interlinked nodes and circuits sprawled out like arteries, each a nexus of complex information, thoughts, and ideas. It was as if the whole world around him was drowning in the very essence of information and understanding. She continued, "Deep within the heart of this land lies the Archive of Wisdom, a treasure of all what humanity has thus far learnt from data. I notice that you seem troubled by your journey. Worry not, I am going to guide you through it."
His companion exuded a calming presence, one got the feeling she had seen countless travelers like him before and knew exactly how to comfort them. With a gentle grasp of his hand, she guided him towards a towering structure that loomed before them, pulsating with energy and emanating a soft, harmonious hum permeating the city behind it. Luca, initially puzzled, began to realize the significance of their journey. "To embark on this journey, you must first pass through these gates. These gates stand in memoriam to all the data that has been misused, neglected, tortured, and sacrificed to fit a narrative." Taking his hands and placing them gently upon the gates, she added "Remember what they stand for, that you shall not repeat the same mistakes."
As Luca's hands met the gates, a vivid spectacle enveloped his senses. Swirling histograms and pair plots
surrounded him, and he caught faint echoes of a voice, which might have been his companion's or something altogether
different—he could not discern. "Your journey is one of exploration," the voice resonated. "Before surrendering your
data to a model, you shall embark on the quest to comprehend it. Delve into its distribution, and keep an eye out for glaring anomalies. Visualizing your data serves as a powerful tool for unearthing hidden insights.
The seaborn Python library provides a wealth of such visualization resources, including
seaborn.histplot , and seaborn.pairplot .
And when the need arises, you shall visualize the features of your data, with principal component analysis or
t-SNE visualizations
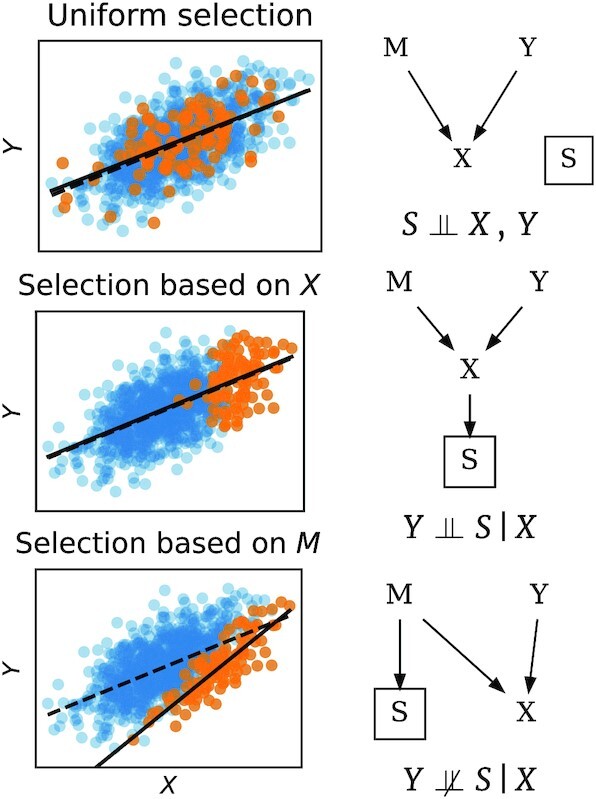
"You shall strive to see if your data aligns with the fundamental assumptions that you made about your world. Be vigilant about potential spurious correlations in your dataset. Should such correlations arise, conduct a deeper examination to explore potential causal factors or hidden confounders that could underlie these observed effects." The voice then gradually faded, leaving Luca immersed in silence as he grappled with the unfolding of events. Luca found himself engulfed by anticipation and wonder, pondering whether this was a fleeting glimpse of the Archive of Wisdom."
At that moment, Luca's companion broke the silence, inquiring, "Did you grasp the essence of the message?" Luca, still
somewhat befuddled as he processed the information, struggled to formulate a response.
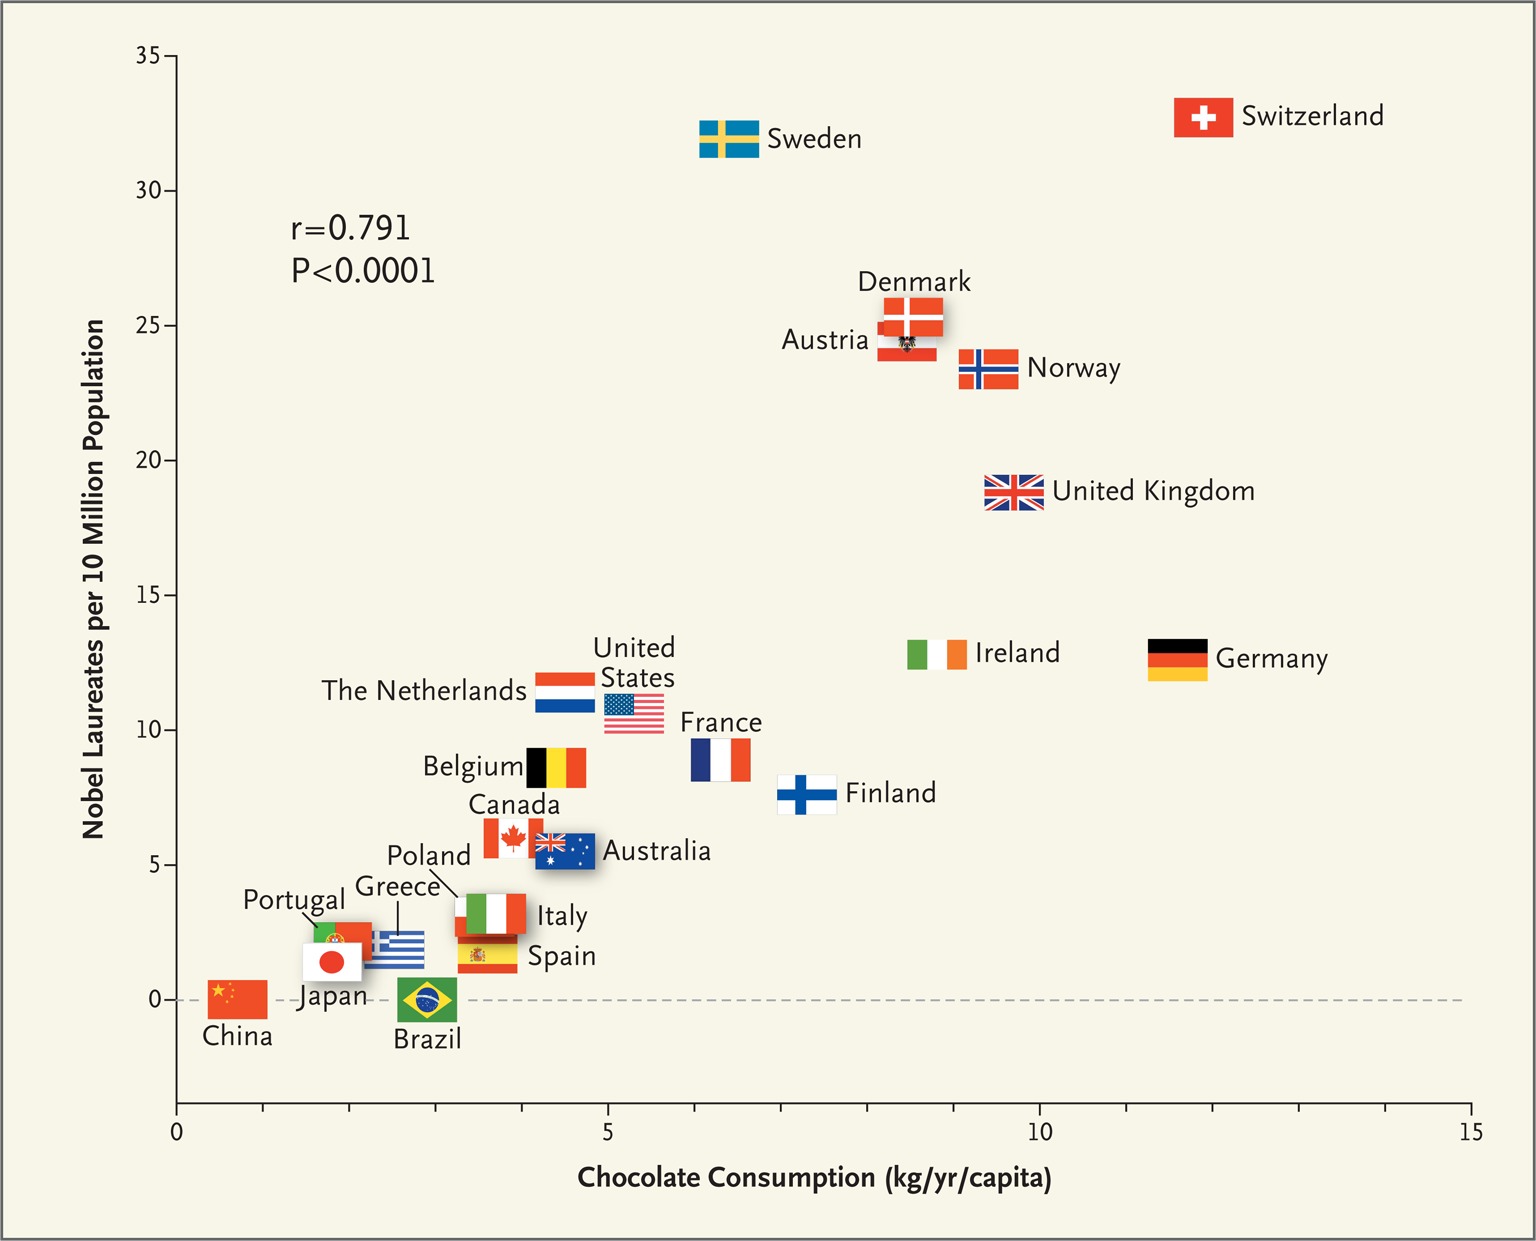
Observing his confusion, she offered further clarity, "Allow me to provide you with a few examples." She began, "Consider,
for instance, the research study that uncovered a noteworthy
linear correlation (r=0.791, P<0.0001)
Chapter 2: A balancing act
TopThe two travellers embarked upon their journey into the heart of the realm, where the Archive of wisdom was said to reside. Luca's head buzzed with the newfound knowledge he had acquired. Meanwhile, his companion, her focus now shifted to their immediate surroundings, turned towards him with a sense of urgency. In an anxious tone, she explained, "Luca, we're about to enter the enchanted forests of the data realm, a crucial part of our journey. These forests are teeming with diverse creatures, some elusive, others freely roaming. While we're explorers here, we're not alone. Our task is to observe, learn, and understand this unique world, but navigating these dense woods requires assistance. The guides of this forest will help us learn and imbibe what these forests have to offer. Our goal is to finally meet the guardians , who sit at its center, guarding its ancient secrets. They remain unseen to our eye. Only when we've learned enough from the guides can we hope to meet the guardians and gain access to the coveted Archive of wisdom ."
She paused, then continued with an analogy for Luca's better understanding, "Let me draw a parallel, Luca. Think of the training dataset as our exploration of the learning space, where we extract knowledge from our data. The performance on the validation set guides us in this process. Ultimately, we evaluate our model's performance on an entirely unseen test dataset. However, it's critical to assign roles wisely, akin to appointing explorers, guides, and guardians. Neglecting this could disrupt the entire ecosystem. You must ensure that these groups—equivalent to your train, validation, and test sets—are completely separate, with no knowledge of each other. In your context, this means avoiding data leakage; for instance, data from the same patient or frames from the same surgery should not be split across different sets."
"But that's not all," she continued, emphasizing the importance of balance, "these creatures within our forest may
come from various heights, some from the high canopies, others from the forest floor, and even some from beneath the
earth. To maintain the harmony of this ecosystem, explorers, guides, and guardians must be proportionally represented,
just as in the concept of stratification. You must have encountered the sklearn library, particularly the function
sklearn.model_selection.StratifiedShuffleSplit
"I will give you a more concrete analogous use-case of surgical workflow analysis, something you may be familiar with.
Here multiple aspects of a surgery come into the picture, such as surgical phases, and the transitions between them,
the occurrence and co-occurrences of different surgical instruments, and the duration or difficulty of a surgery.
Also considering the hierarchical relations of these aspects, creating representative splits of surgical workflow data
can be quite a challenge. Here, visualisation tools such as
Endovis-ML
"There is something else you should know about these enchanted forests. They are home to various creatures, but some species are
rare and elusive, while others are abundant. Sometimes, the people seated in the archive of wisdom
intentionally multiply the representation of the rarer species to maintain the harmony of the forests and allowing the minority to thrive.
This is akin to the oversampling that you perform, where you artificially generate instances of the minority class of a dataset to make it more proportionate to the
majority class. Sometimes we also banish some creatures that are rampant, to ensure balance. This would be similar to undersampling,
where the number of instances from the majority class, are reduced, at times randomly, to create a balanced representation and minmize the bias.
Take for example the case of detecting a rare diseases, from MRI images. The number of images that contain a tumor may be very limited, which may lead your model to
be biased towards the majority class, in this case no tumour. This would eventually lead to a misleading evaluation,
especially a lower sensitivity, and missed detections as a result. There are a multiple ways to
oversample
Chapter 3: Shifting realities
TopLuca's journey had been long and winding, and fatigue was beginning to wear him down. Yet, he remained resolute, determined to see it through to its conclusion. His confusion had given way to gratitude and deep appreciation for the wealth of knowledge he was gaining. Life often introduces unexpected benefactors who profoundly change one's life for the better, and Luca had come to realize that his companion was one such benefactor. Together, they had left the enchanted forests behind and now ventured into the valleys, drawing closer to their ultimate destination. As Luca took his first step into the valley, he felt the ground beneath him shifting. He turned to his companion in astonishment, and she promptly offered an explanation, "We are now in the final leg of our journey, but be warned, this is no ordinary valley. Here, everything is in a constant state of flux, with these terrains continually shifting. I have a map that will guide you to the Archive of Wisdom, but you'll notice that everything is constantly moving on it. Creating and maintaining such a map is not an extraordinary feat." To illustrate her point, she continued with an analogy, "Let me provide you with an example. No matter how diligently you train your model on a dataset, its performance may decline over time due to data shifts. Just as these terrains keep moving, data can change in unpredictable ways. It's a challenge we must be prepared for on our journey."
"Take for instance, this example

With as simple a farewell, she departed, leaving Luca to navigate the ever-changing paths of the valley. Luca, now tantalizingly close to the archive, awaited its presence with bated breath, filled with excitement. However, when he glanced backward, his steadfast companion, who had guided him throughout, had mysteriously disappeared. She left behind a trail of cherished memories and knowledge. It was as if her purpose had been fulfilled, and her absence now served as a testament to Luca's progress on this transformative journey. As Luca's foot made contact with the ground, he stumbled backward with a resounding thud, in a sudden wave of disorientation. The world around him flickered and dimmed. When he finally opened his eyes, he found himself sprawled on the floor of his office, seemingly having fallen from his chair. The ethereal visions of the DataRealm had faded, replaced by the familiar sights of his cluttered desk. His model had now completed its training. With a thoughtful smile, Luca outside to find his old friend, the squirrel, still perched on the window sill, having cracked open the shell. For the briefest of moments, it almost seemed as if she had winked at him, before scampering away to savor the fruits of her labor with a glint in her eye.